Finance – Recessions and Fear
By: Curt Stowers
Taking a Look at the Data
This week we are back again with a picture that is worth a thousand words. The chart below highlights the growth in the market over time with the periods where recessions are present highlighted in green:
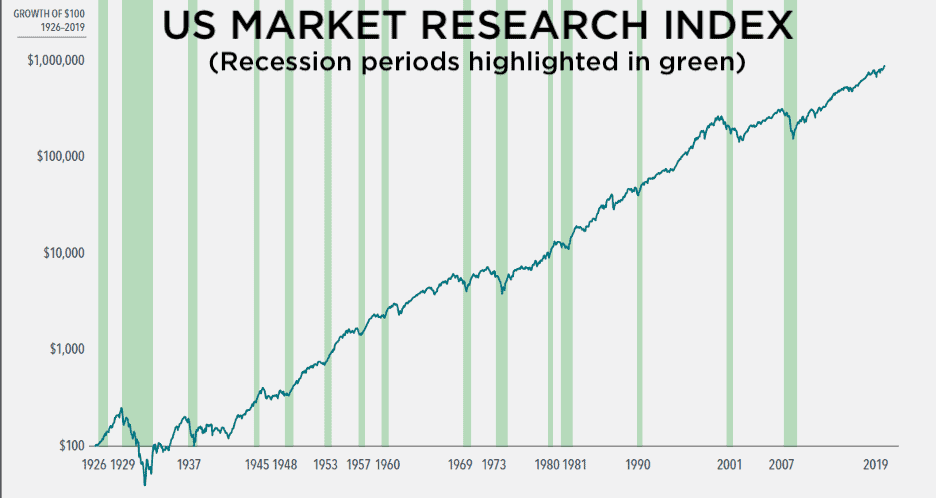
The data displayed is what’s known as the “US Market Research Index” which was developed by Kenneth French of Dartmouth University. You can see more information on the above photo and also the data sources by following this link. The link will take you to a very nice PDF file where you can drill down into the data.
There are—in my opinion—two key messages that jump out at you from the data:
- If your time frame is beyond a few years, recessions are NOT very scary.
- If your time frame is a single year, recessions can be very scary.
Looking at the data, you see the following averages for all of the periods.
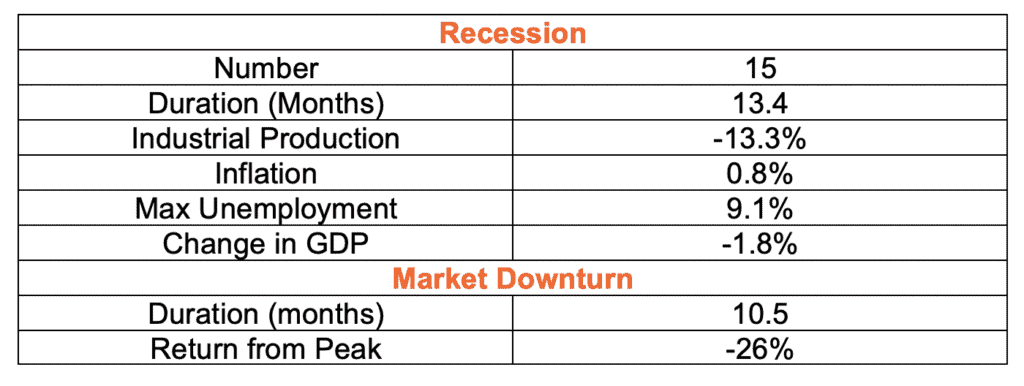
So, there were 15 recessions that lasted an average of 13.4 months. Industrial production fell 13.3% on average and the maximum unemployment averaged 9.1%. The GDP dropped by 1.8%.
From a stock market standpoint, it took 10.5 months from the market peak prior the start of the recession to hit the bottom and the market was down an average of 26%.
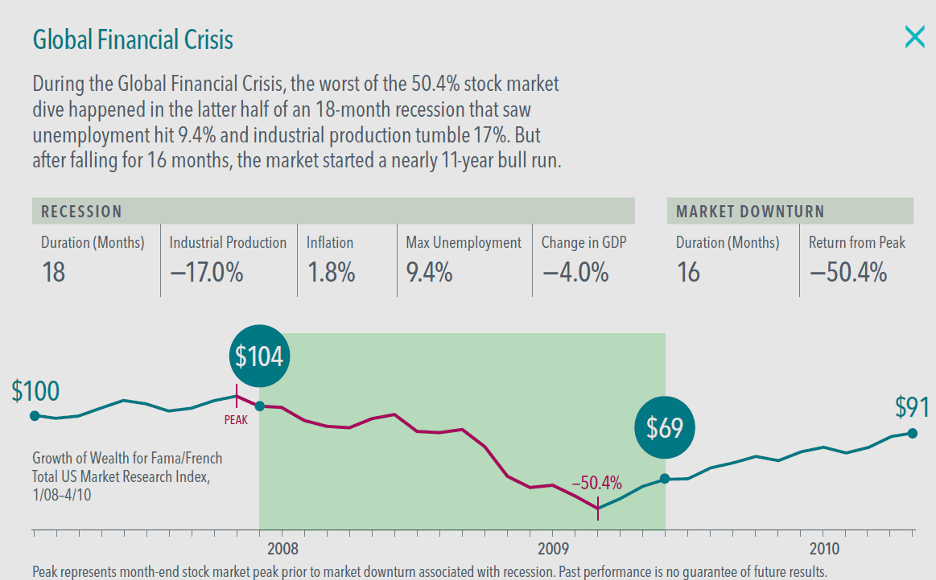
To better understand this chart, it is helpful to look at one particular period of a recession:
Given the above, the key question in my mind is:
- Are you an investor or a speculator?
To answer this, it’s necessary to define the terms a bit further. I would consider an investor someone who is looking for returns (rewards) over the long term (decades or more) with low risk (volatility) Conversely, speculators are looking for returns (rewards) over the short term (inside a year) with high risk (volatility).
In my mind investors, are going to focus on the first chart above and speculators on the second. However, ultimately only you can answer this particular question. If you are having trouble answering, you’re welcome to reach out to F5 Financial, and we’ll be happy to discuss the topic with you further.
You can see more about the above chart here.
Would You Like More Support?
- Do you have a well-defined Investment Policy Strategy that is used to drive your investments in support of a comprehensive financial plan?
- If not, would you like to partner with someone who is used to helping people get through these struggles and (then, with confidence) implement portfolio strategies in a systematic manner while focusing on your desired outcomes?
If so, feel free to send us an email or give us a call. We’d love to have the opportunity to help you find a bit more peace of mind when it comes to investing.
Photo credit: Dimensional Fund Advisor
F5 Financial
F5 Financial is a fee-only wealth management firm with a holistic approach to financial planning, personal goals, and behavioral change. Through our F5 Process, we provide insight and tailored strategies that inspire and equip our clients to enjoy a life of significance and financial freedom.
F5 Financial provides fee-only financial planning services to Naperville, Plainfield, Bolingbrook, Aurora, Oswego, Geneva, St. Charles, Wheaton, Glen Ellyn, Lisle, Chicago and the surrounding communities; to McDonough, Henry County, Fayette County, Atlanta and the surrounding communities; to Venice, Sarasota, Fort Myers, Port Charlotte, Cape Coral, Osprey, North Port, and the surrounding communities; and nationally.
We'd love to have the opportunity to hear about your situation. Contact us here to schedule an appointment for a consultation.
Learn more about What We Do.
Helping You With
Wealth Preservation – Wealth Enhancement – Wealth Transfer – Wealth Protection – Charitable Giving